




API readings fudged? Let's compare with S'pore, Thailand
COMMENT In my article yesterday , I made the assertion that the disconnect between Malaysian’s Air Pollutant Index (API) and the reality on the ground is not due to the manipulation of numbers.
I had gone on to put forth a more plausible explanation for the dissonance, but never quite found the space to explain why I do not believe there is a cover-up taking place.
I was not parroting government statements on the matter.
Instead, thanks to the wealth information provided by our Thai and Singaporean neighbours, it is actually possible for me to verify this, at least for our monitoring stations near the borders.
COMMENT In my article yesterday , I made the assertion that the disconnect between Malaysian’s Air Pollutant Index (API) and the reality on the ground is not due to the manipulation of numbers.
I had gone on to put forth a more plausible explanation for the dissonance, but never quite found the space to explain why I do not believe there is a cover-up taking place.
I was not parroting government statements on the matter.
Instead, thanks to the wealth information provided by our Thai and Singaporean neighbours, it is actually possible for me to verify this, at least for our monitoring stations near the borders.
By the end of this article, you can too.
 Method One:
The easiest way to verify whether the Department of Environment (DOE) is ‘fudging’ its API numbers is through
AQICN.org
, which provides air quality reports for numerous cities around the world.
Method One:
The easiest way to verify whether the Department of Environment (DOE) is ‘fudging’ its API numbers is through
AQICN.org
, which provides air quality reports for numerous cities around the world.
The website takes air quality indexes from the respective government agencies, and converts it to the US Air Quality Index (US-AQI) where necessary.
In the case of Malaysia , AQICN uses the DOE’s figures as-is because of the similarities between the Malaysian API and the US-AQI.
The Singapore Pollutant Standards Index (PSI) calculates from raw measurements the same way as the US-AQI, so once again the AQICN website uses those figures as-is.
However, Thailand calculates its own index in a way a little more different than the US-AQI, so AQICN converts those figures to the US-AQI standard.
In other words, the figures presented on AQICN’s website can be compared from one country to another, despite each country reporting its index slightly differently.
Thus, by looking at the air quality indexes in neighbouring border towns on either side of our borders, one can search for possible inconsistencies.
Ballpark figure
For example, one should expect Hat Yai to have similar readings on AQICN as Kangar, even though they are on opposite sides of the Malaysian-Thai border.
Hat Yai is about 70km away from Kangar, and as of Monday, the two places were downwind from the forest fires of Sumatra.
Hence, the US-AQI readings reported on AQICN’s website should be similar, and as far as I can tell, indeed they are.
As of 7pm yesterday, which was when AQICN last updated its data for Hat Yai at the time of writing, the US-AQI for the city was reported to be 103.
On the other hand, the API for Kangar at the same time was 110, which is close enough.
These figures shouldn’t be expected to match, but should at least be in the ‘same ballpark’.
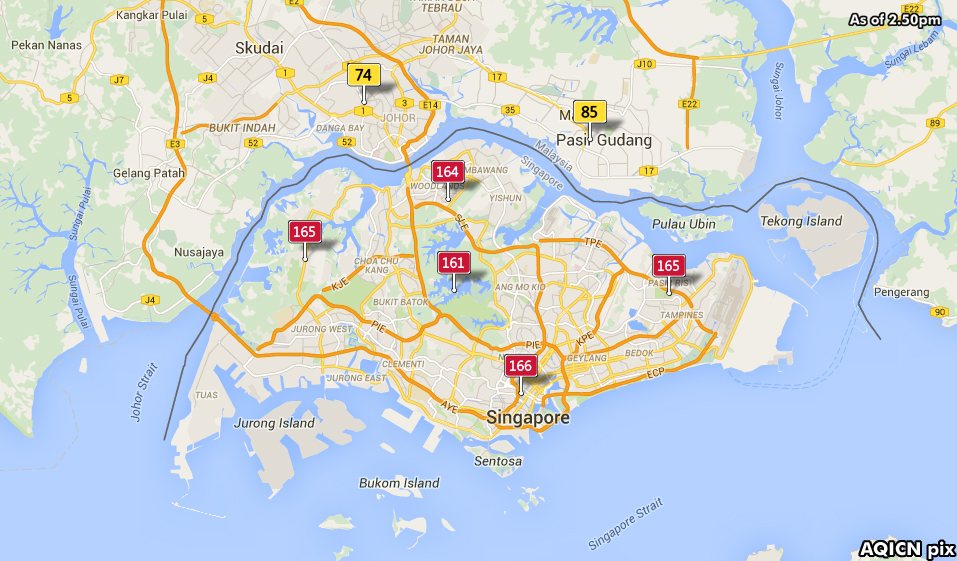
Meanwhile, in the Straits of Johor, the close proximity between Larkin Lama, Pasir Mas and Singapore’s northern region means comparisons can also be made in these places.
However, care should be taken in reading AQICN’s figures in this regard.
As already widely reported throughout the current haze season, Singapore has started measuring particles below 2.5 microns in diametre since last year, also known as PM2.5.
In contrast, Malaysia’s API only accounts for particles 10 microns in diametre or less - also known as PM10.
Due to a number of reasons, this leads AQICN’s website to highlight a far higher figure in Singapore than its Malaysian counterparts.
However, Singapore still measures and reports its PM10 figures. The information is also is available from AQICN’s website, but is displayed less prominently.
But once again, the figures tally.
As of 7pm yesterday, which is the latest time where data is available from all three places, Singapore’s northern region registered a PM10 sub-index of 80.
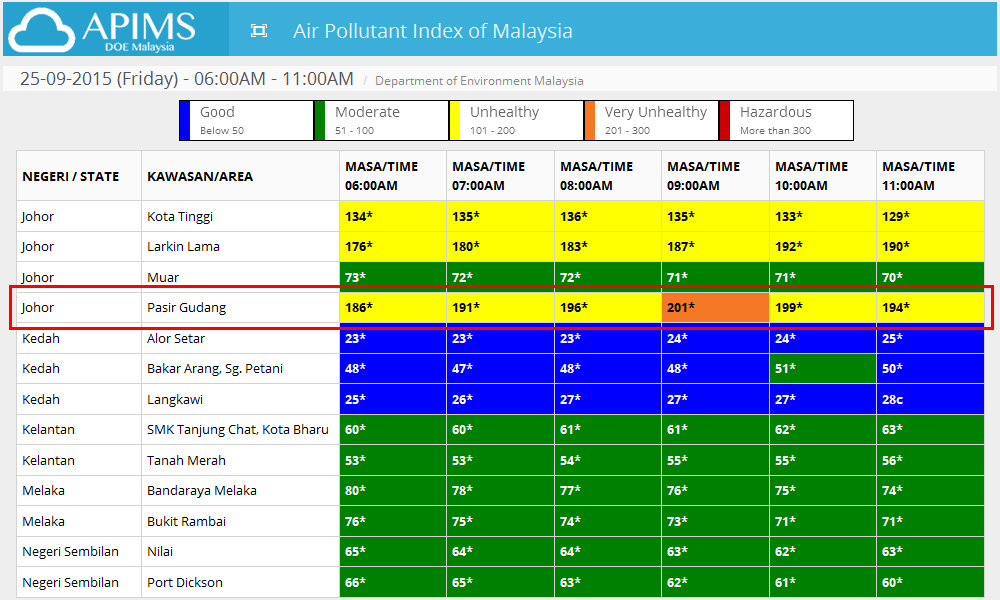 Meanwhile, 10km away at the
Larkin Lama
air monitoring station, the API was actually slightly higher at 93, while the API in nearby
Pasir Gudang
was 107.
Meanwhile, 10km away at the
Larkin Lama
air monitoring station, the API was actually slightly higher at 93, while the API in nearby
Pasir Gudang
was 107.
For the record, its overall PSI reading in northern Singapore at the time was still higher at 124, due to PM2.5 being taken into account.
The PM10 sub-index takes account of PM10 measurements alone.
Unfortunately, I have to omit bringing Brunei and Indonesia into this disucssion because for Brunei, there is scant information available in the public domain on how it converts API measurements into its version of the PSI.
As for Indonesia, its monitoring stations are simply too far away from Malaysia’s monitoring stations to make useful comparisons.
Handbook available online
Method Two: The ‘hard way’ that I describe here is essentially the same as the ‘easy way out’, except that it skips using AQICN as the middleman.
Instead, information is gleaned directly from the websites of the national agencies that report them.
To make our comparisons, we need to understand what the API reported by the DOE actually means, at least when it comes to PM10.
As explained yesterday, the DOE measures the PM10 concentration in the air and obtains an average figure over a 24-hour period.
That figure is then assigned an index number corresponding to how harmful such concentration of PM10 is to our health.
 Each country does this conversion process to the index number slightly differently, thus complicating direct comparisons between countries.
However, the DOE only reports the API figure on its website without providing the numbers used to arrive at those figures.
Fortunately, the department also has a handbook available online that provides the tables and formulae used to calculate the API from measurements of pollutant concentrations.
Thus, it is possible to work backwards and determine the PM10 concentration, using the API figures.
Take Kangar for example, with its API of 110.
Based on the table on Page 9 of the handbook, one could determine that the PM10 concentration at the time was 170 micrograms per cubic metre.
(The other pollutants mentioned in the handbook are not relevant to our discussion about haze, as PM10 and PM2.5 are the dominant air pollutants in such conditions.)
The PM10 concentration in Hat Yai at the time? The numbers are available directly from the Thai Pollution Control Department’s website.
It is 174 micrograms per cubic metre, just four micrograms per cubic metre more than Kangar. It is essentially the same story when making comparisons with Singapore.
This is because its National Environment Agency (NEA) makes its measurements readily available on its website , in addition to the PSI.
No sinister plan
By looking up the relevant part of NEA website, one will find two numbers for the PM10 concentration in Singapore North as at 7pm yesterday, which is written as: 110 (80)
The first number, 110, is the PM10 concentration in micrograms per cubic metre. The second number, 80 in brackets, is the PM10 sub-index.
The sub-index means that if PM10 had been the main pollutant at the time instead of PM2.5, the PSI would have been 80.
 As for Malaysia’s monitoring station in Larkin Lama, its API of 93 corresponds to a PM10 concentration of 136 micrograms per cubic metre.
This is 26 micrograms per cubic metre higher than the measurements in Singapore North. Again, it is a close match.
For brevity’s sake, I shall omit doing the same for Pasir Gudang.
But I hope that through this article and the one I have written on the same topic yesterday, you can be convinced that there is no sinister plan to downplay the API.
Instead, attention can be focused on where the problem truly lies.
The API and many indexes like it around the world are meant to simplify the reporting of air quality to members of the public.
It is so that they can take precautions when they need to, or enjoy the fresh air when they can.
Instead of remembering at what levels the five or six different pollutants will pose a health risk, everything is boiled down to a single number.
However, by being slow to respond to rapid changes in air quality and by not taking account the more harmful effects of PM2.5 (as compared to PM10), the API has failed to serve its purpose.
KOH JUN LIN is a member of the Malaysiakini Team. He keeps a small personal cache of respirators well in advance of the annual haze season - just in case.
Yesterday
Why is API so low when it's a post-apocalypse movie outside?
Related report


